

Activity Feed - Debugging Lambda Latency Increase Post-Deployment
Activity Feed - Debugging Lambda Latency Increase Post-Deployment
Our Activity Feed service had been on Node 12 for years, as we had no developers with enough knowledge to confidently upgrade – until it was made mandatory. We tested the changes extensively and dealt with several bugs in beta and integration testing, but we finally got everything working and deployed to prod, confirming that both POST and GET request use cases were working.
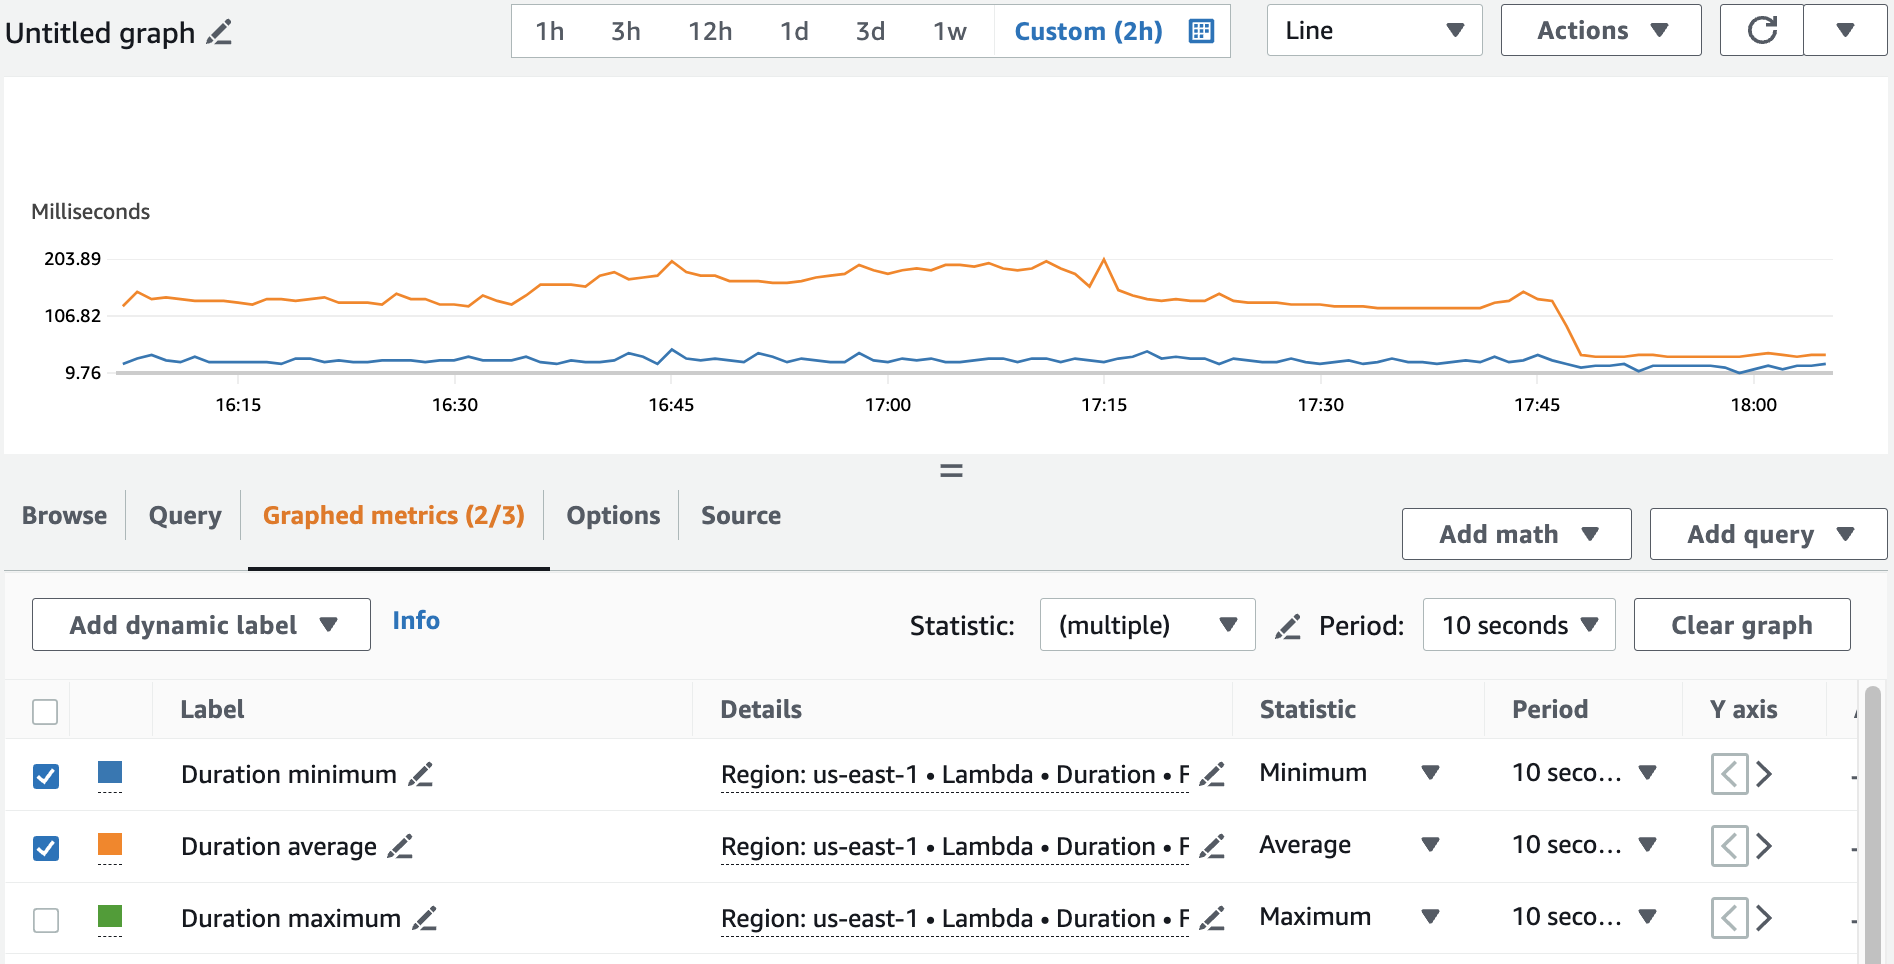
However, post-deployment of Node 18, we noticed latency increased across all regions for the Lambdas that were serving customer traffic. It wasn’t clear from the dashboards why this was happening, and the RDS database (the usual culprit) seemed to be performing normally. Latency had gone from a p95 of about 60ms to about 170ms. It was apparent from the Lambda “Monitor” dashboard that the duration was increased, but the errors were normal and no other graphs seemed weird. I also looked at the CloudWatch logs and analyzed the longest invocations, but there weren’t any apparent errors or indicators of latency besides the query to RDS taking a while. This almost sent me down the wrong path, as we’ve had a lot of difficulty with knex and connecting to RDS, but those issues were usually a complete inability to connect, rather than just a slow connection.
I asked my coworker and resident backend expert, Dhiraj, to help me debug, as I’d spent a day or two and didn’t want to use too much time without knowing what I was looking for. First, Dhiraj asked if we could check out Lambda Insights for more information on how the lambdas were operating and more specifically their Memory and CPU usage. But unfortunately, we’d never set this capability up and would have to enable and wait for data to roll in, not to mention the heightened cost of having this enabled. However, this is when Dhiraj pointed me to a resource I didn’t know existed.
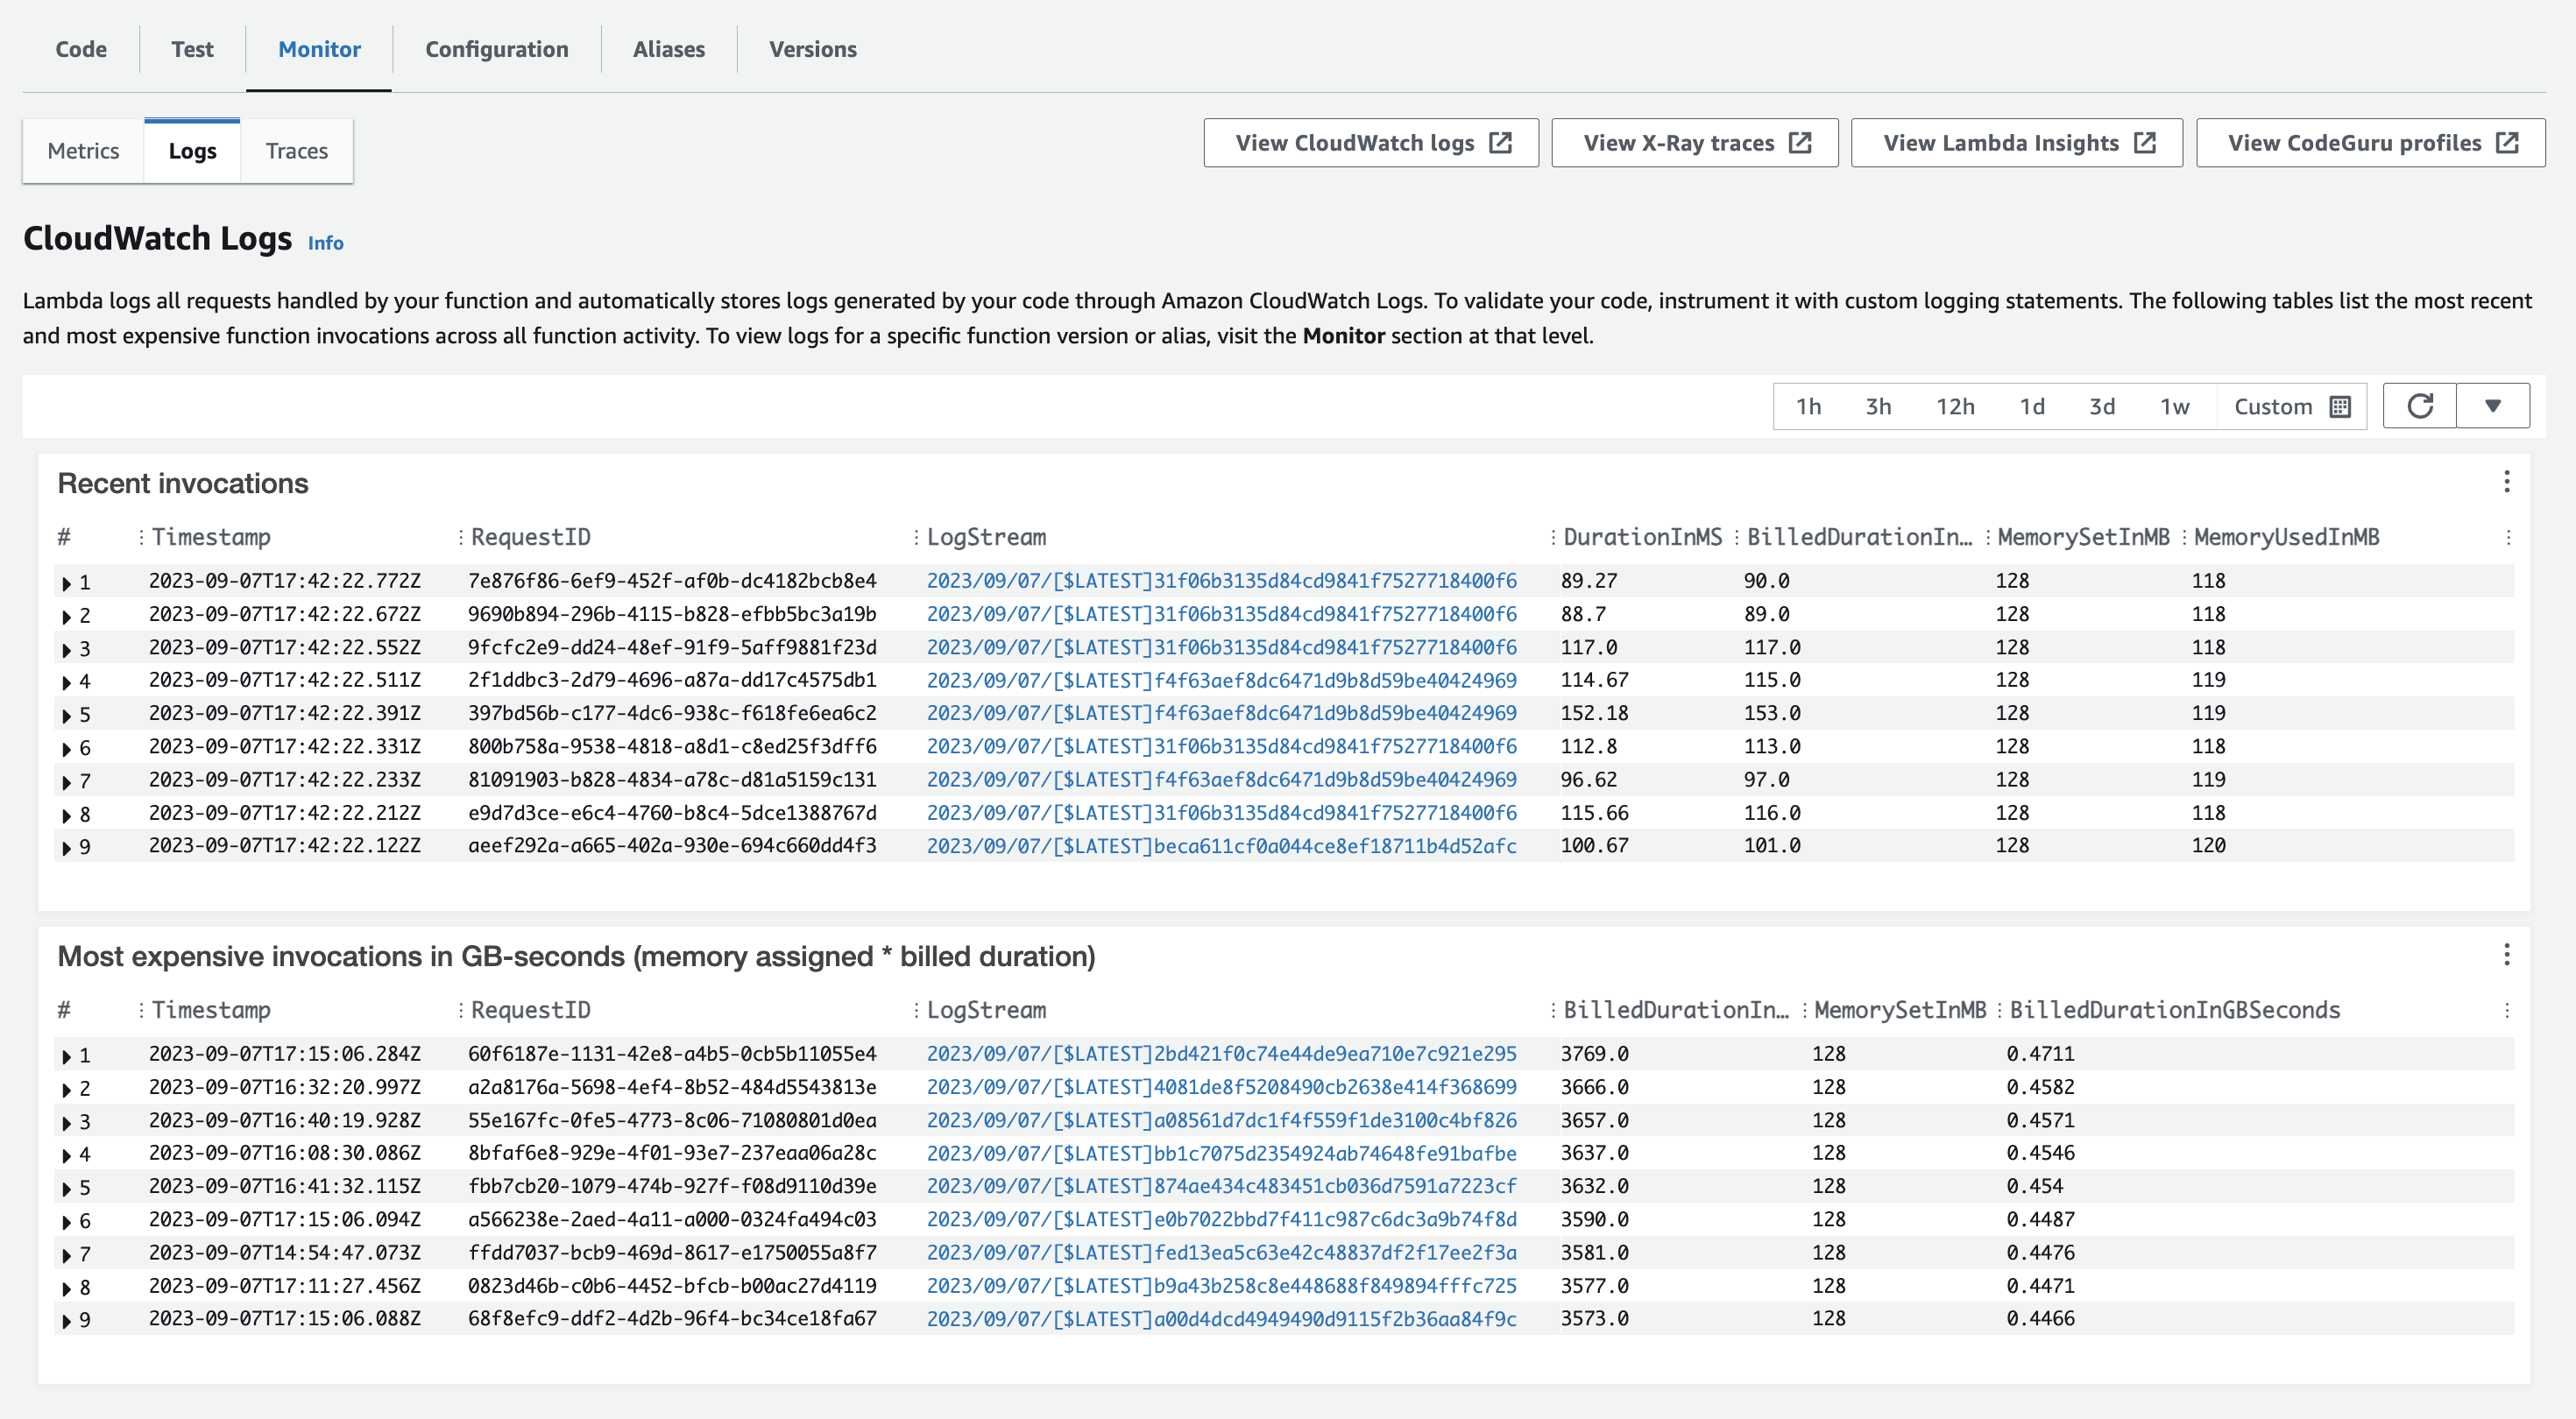
On the Monitor tab of the Lambda console, it turns out the “Logs” section does not just link to CloudWatch Logs as one would think, but actually shows the logs as they roll in with metadata attached! And more specifically, the metadata showed the allocated Memory for each invocation, as well as the MemoryUsed for each invocation. This was when we spotted the issue – the memory allocated was 128MB, while the MemoryUsed was 118MB, very close to the limit. These logs also listed their latencies, which matched the elevated values we saw in the graphs. I noted that I believed the memory was lower than it had previously been, as I recalled seeing the value in the configuration before. Upon checking an older version of the lambda, I noticed it had previously been set to 3008MB!
I quickly realized that when we deployed the new lambda versions, it must have overridden the memory value set in the AWS console – which had probably been manually set without updating the Code. It also would make sense that the lambda would update this time even if it hadn’t updated in a while, because the Node version upgrade would change the code being deployed.
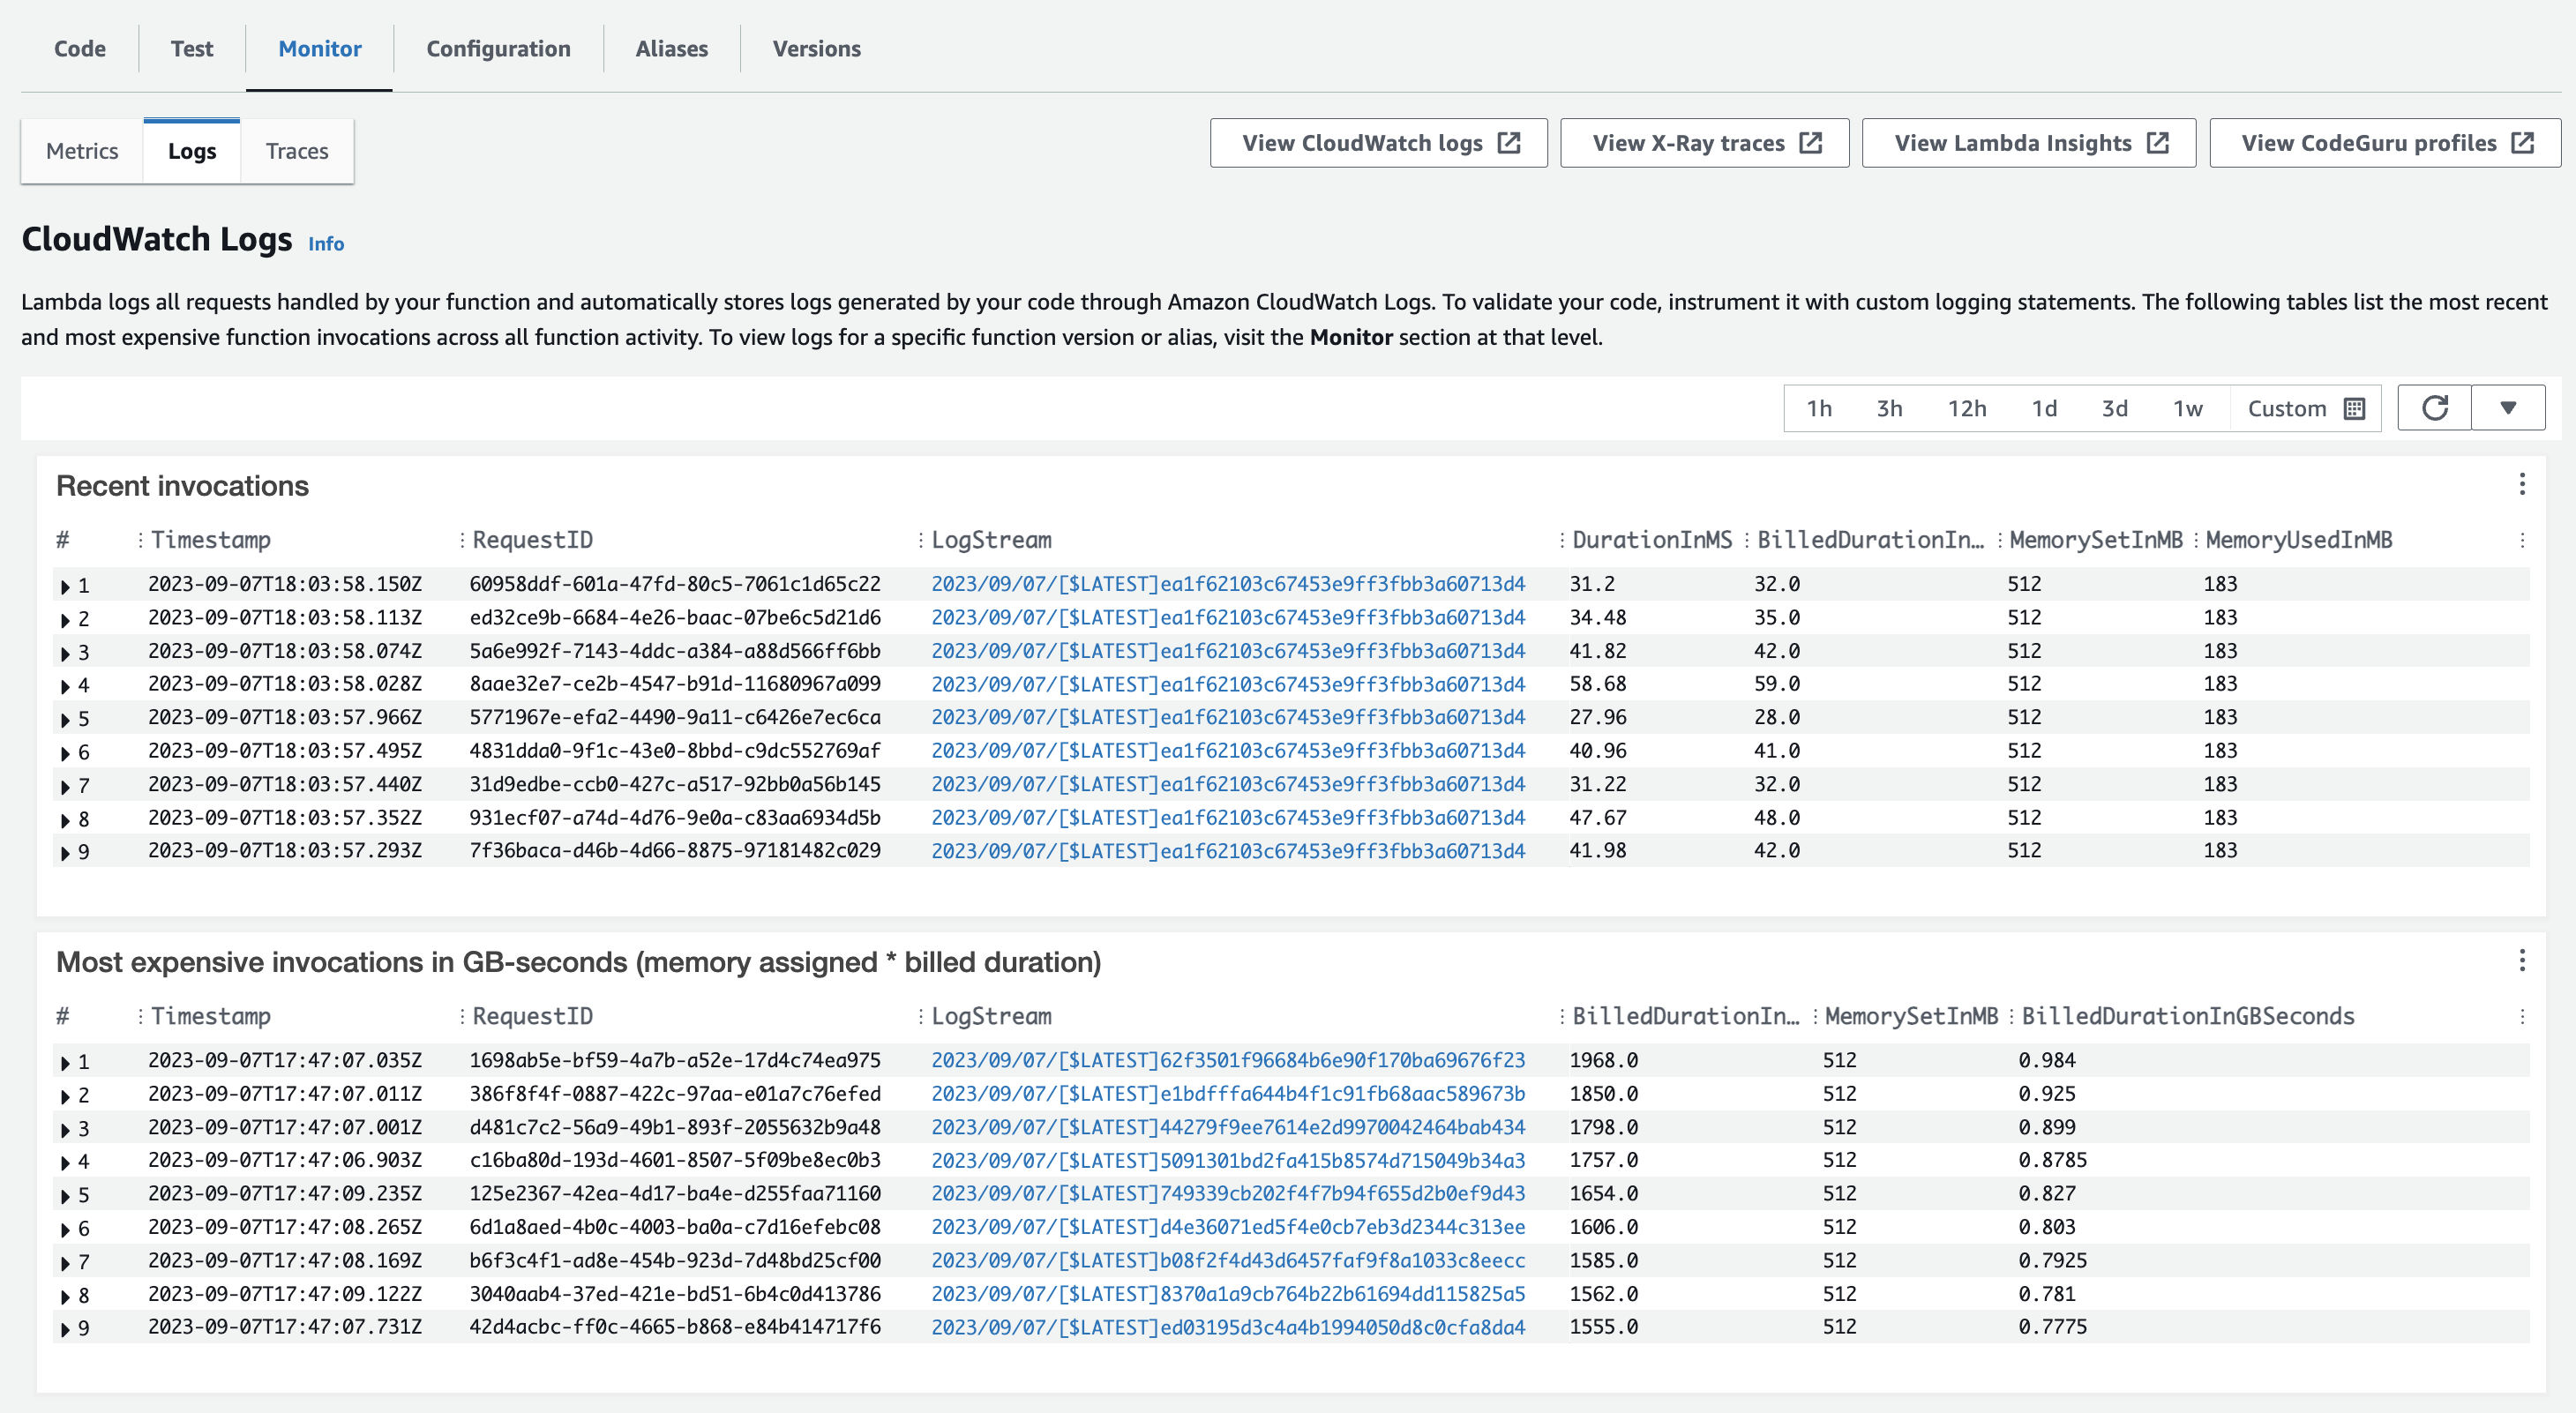
After increasing the configured memory to 512MB (frugality), we saw latency dip down to about 80ms P95 again. and the MemoryUsed increased to 183MB, showing that the Lambdas would in fact use more memory if they were allowed to. I then made sure to add the value to the CloudFormation template in our code, so that the issue would not happen in the future.
The main learning I’d like others to take away from this is to be aware of this “Logs” feature in the lambda monitoring console. A secondary learning would be that increased latency of lambdas, without a corresponding increase in errors, is likely due to the allocated memory (or other config value) being too low.
See images of the “before” and “after”, as well as a graph of the fix’s effect:
Before:
After:
Post fix: